An interactive story on Eurostat data

The 88%
problem

Where Europe's materials actually go.

Of every 100 units of material Europe's economy uses,
only 12 came from recycled waste.

12.2% circular material use rate, EU-27, 2024. Source: Eurostat, env_ac_cur

Scroll
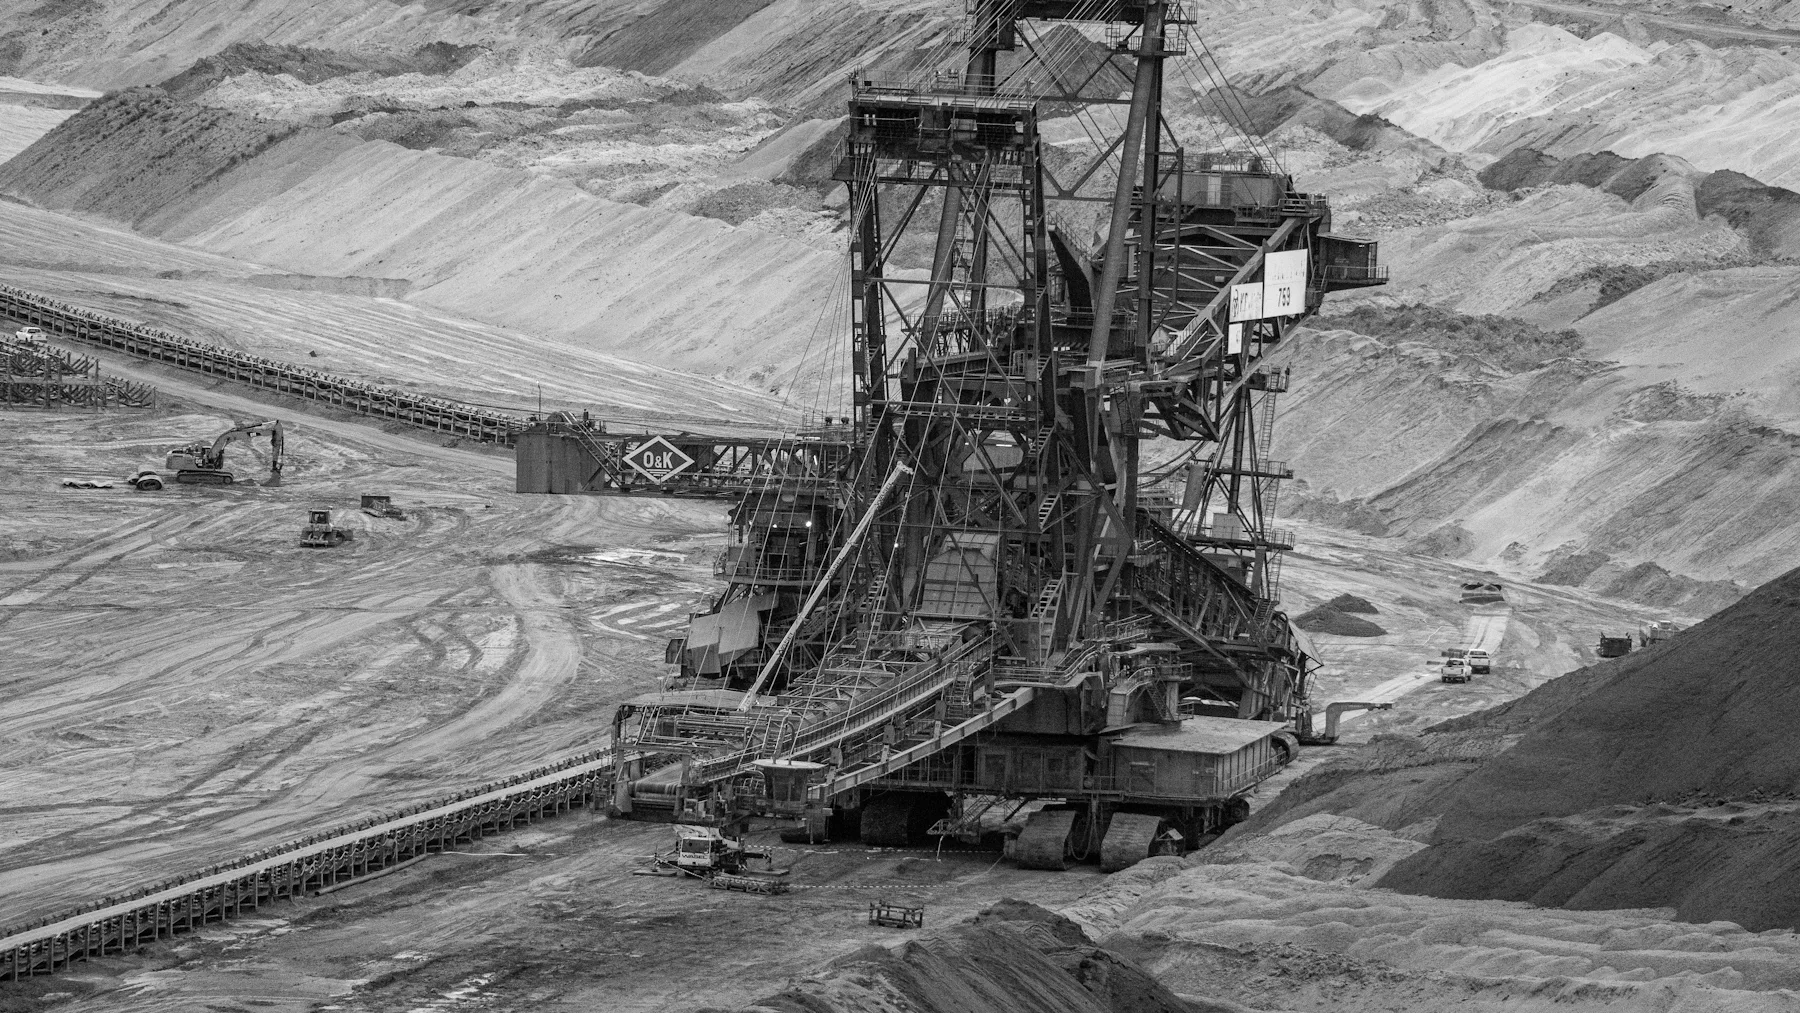
Bucket-wheel excavator in an open-cast mine

5.17 billion tonnes

dug, quarried, pumped and harvested inside the EU in a single year.

Domestic extraction, EU-27, 2024. Source: Eurostat, env_ac_sd. Photo: Chris Münch / Unsplash.

All material flows, EU-27, 2024 · billion tonnes · circularity rate (all materials): 12.2%

Back in the loopStill in use or exportedEmitted or disposed

Source: Eurostat, env_ac_sd and env_wassd (2024); circularity: env_ac_curm. Energy flow derived as processed − exports − material use.

01 — Where it comes from

7.70 billion tonnes

That is how much material the EU processed in 2024: around 17 tonnes for every resident.

  • 5.17 extracted from European soil, forests and seabed
  • 1.49 imported
  • 1.04 recovered from waste: recycled or backfilled

Source: Eurostat, Material flows in the circular economy, 2024 data.
02 — Where it goes

Most of it never comes back

  • 2.42 burned for energy: fuel, food and feed that leave as emissions
  • 2.92 locked into buildings, roads and other long-lived stock
  • 0.66 exported
  • 1.70 becomes waste, of which 0.55 is landfilled and 0.11 incinerated

Source: Eurostat, env_ac_sd, env_wassd, 2024.

03 — The loop

One thin line back

Only the blue flows are circular: 0.75 billion tonnes recycled and 0.29 used as backfill. Measured the way the EU tracks it, just 12.2% of the material Europe uses comes from recycled waste.

Circular material use rate, EU-27, 2024. Source: Eurostat, env_ac_cur.

04 — Material by material

Not all materials are equal

Use the filters above the chart to compare circularity by material. Metals come back best at 23.4%. Fossil energy materials barely come back at all: 3.8%. They are burned once and gone.

Circularity rate by material, EU-27, 2024. Source: Eurostat, env_ac_curm.

Show the numbers as a table
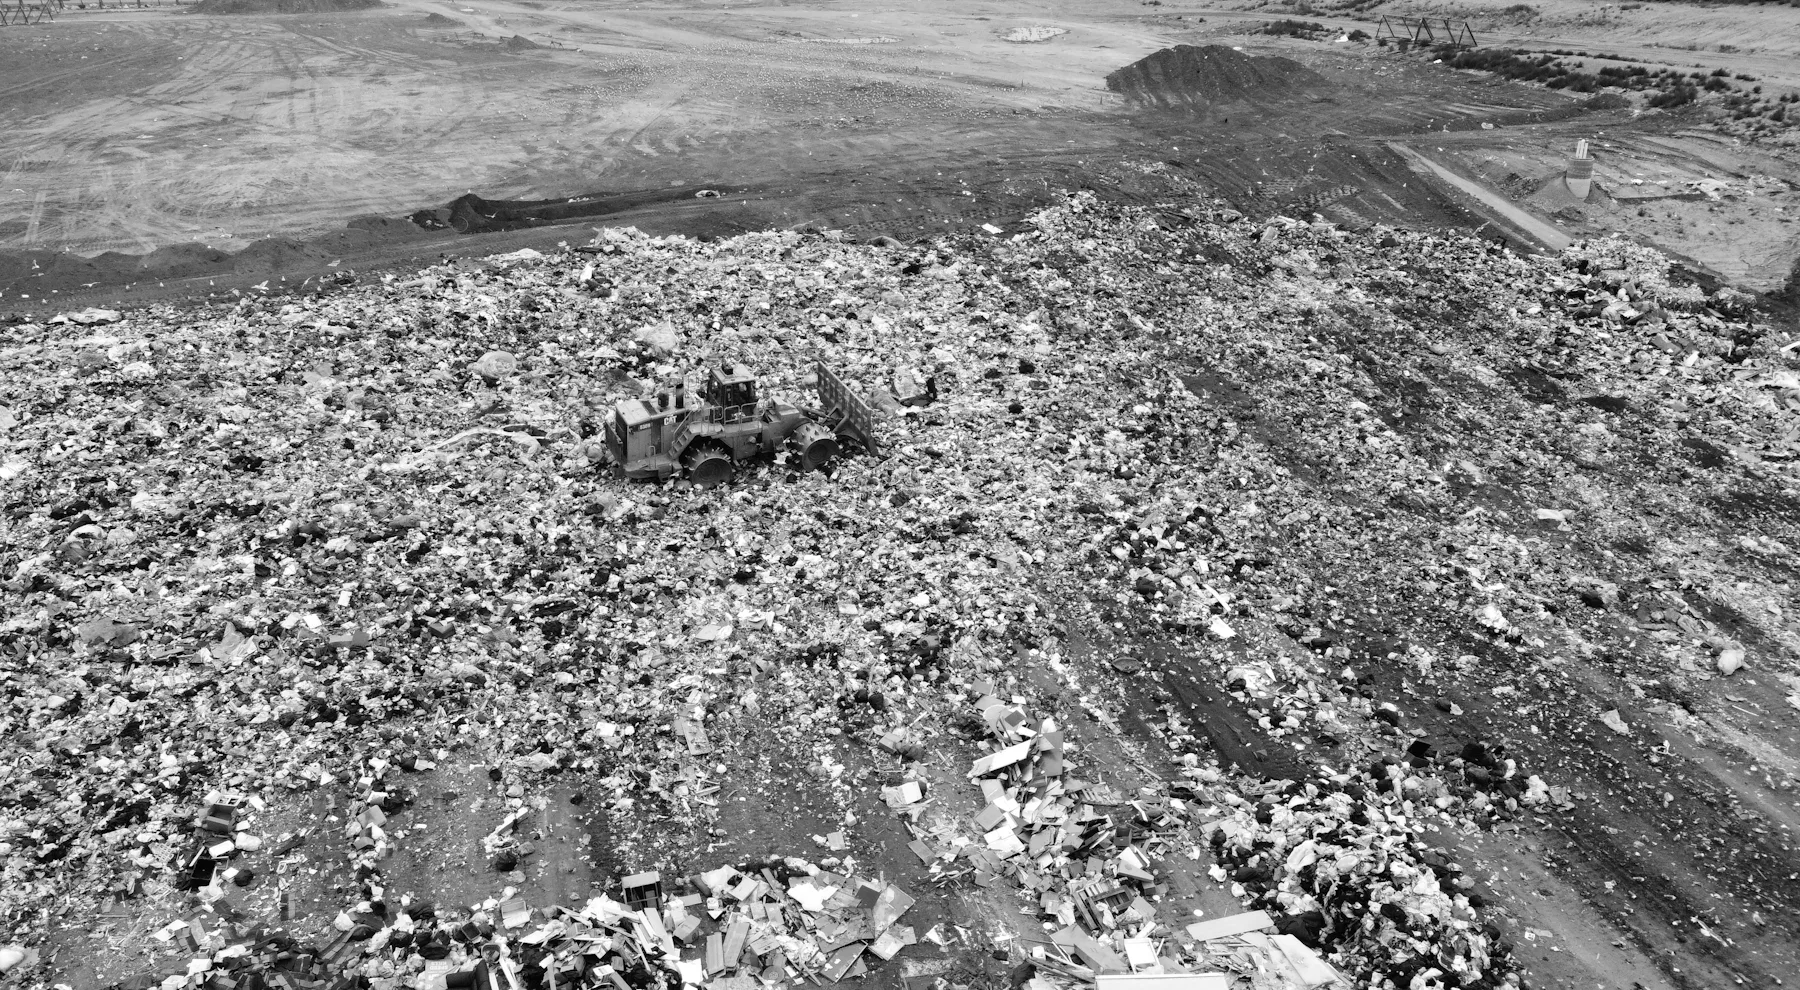
Bulldozer compacting waste at a landfill site

0.55 billion tonnes

of European waste was landfilled or otherwise disposed of in 2024. Mined, made, used and buried.

Landfill and other disposal, EU-27, 2024. Source: Eurostat, env_wassd. Photo: Daniel Miksha / Unsplash.

05 — The European comparison

Even the leaders are far from closing the loop

Circular material use rate per country, 2024. The Netherlands leads at 32.7%. The EU as a whole sits at 12.2%, and wants to reach 24% by 2030.

Source: Eurostat, env_ac_cur, 2024. Target: European Commission, Circular economy (“double it to 24% by 2030”).

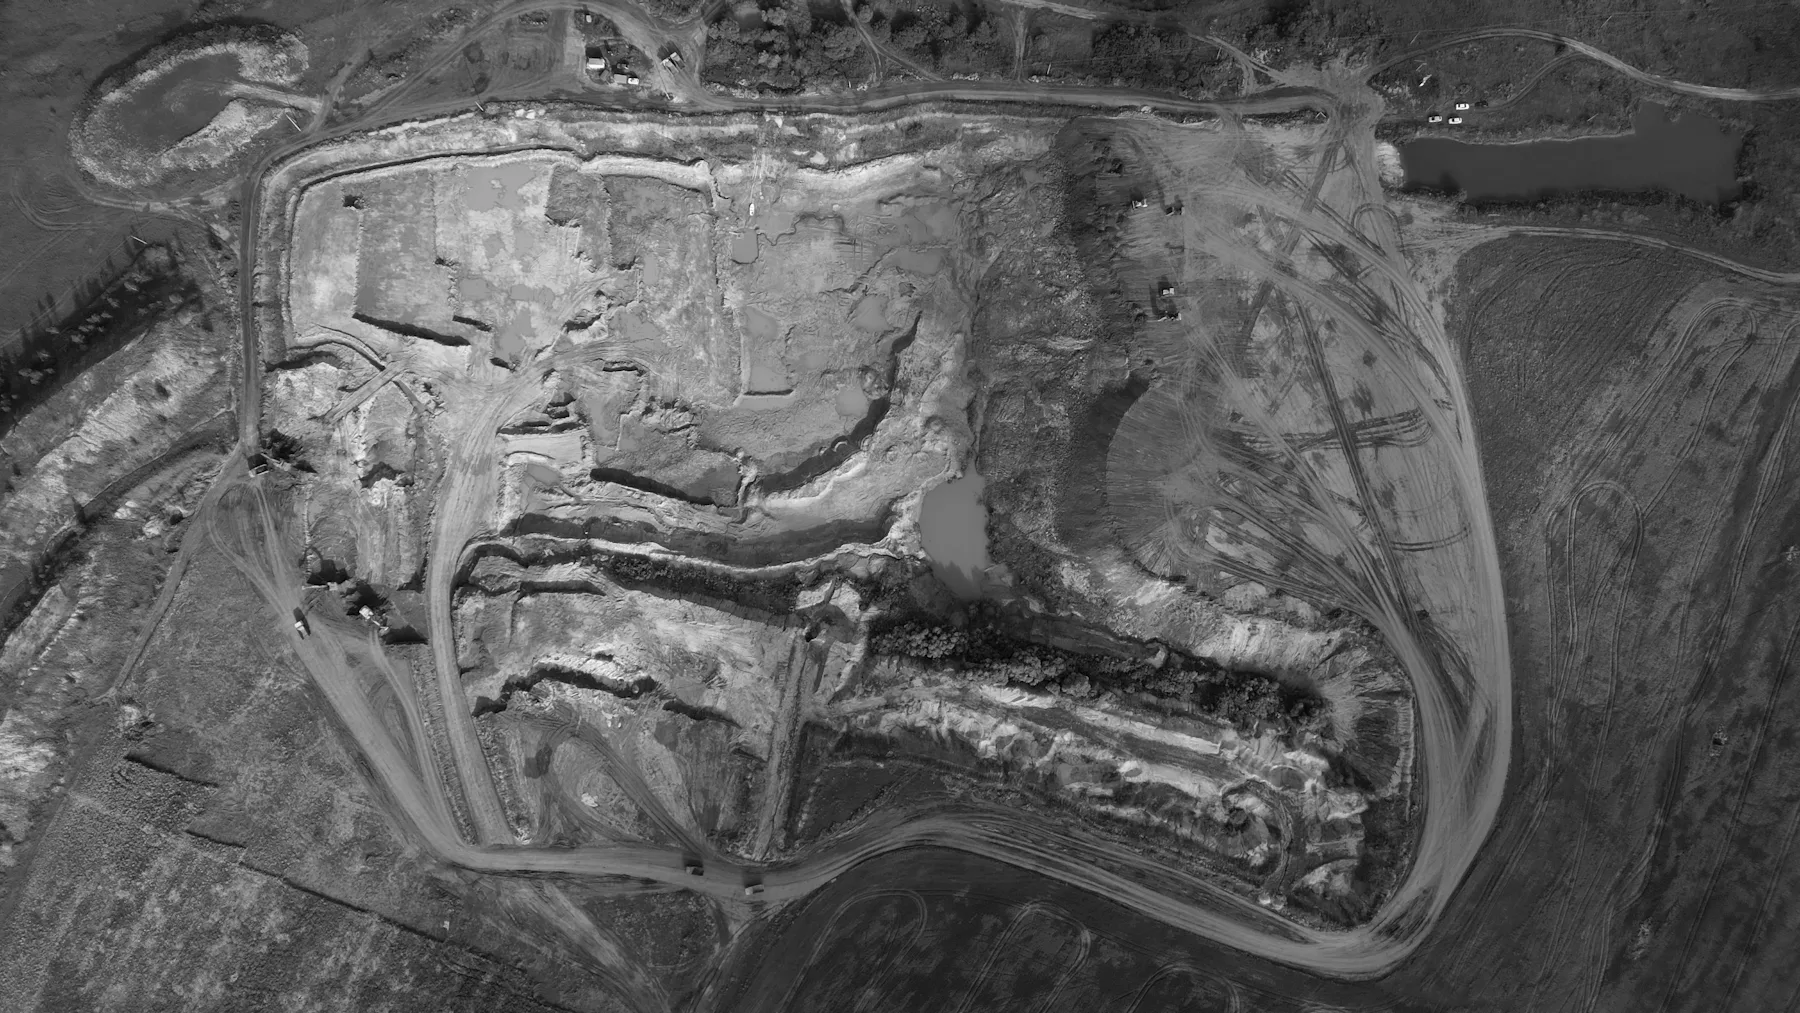
Aerial view of a large rock quarry

The world now extracts more than three times as much material as it did in 1970.

Source: UNEP International Resource Panel, Global Resources Outlook 2024. Photo: Aleksandr Galichkin / Unsplash.

06 — The threat

The world is heading the other way

Global material extraction more than tripled between 1970 and 2020. Without a change of course, it could reach 160 billion tonnes by 2060: 60% more than in 2020.

Source: UNEP International Resource Panel, Global Resources Outlook 2024. 2060 is a historical-trends projection.

55%+

of global greenhouse gas emissions come from extracting and processing resources.

Source: UNEP International Resource Panel, Global Resources Outlook 2024.

The data is already there.
The question is whether anyone will remember it.

Your report deserves more than a PDF. Let's turn it into something people explore, understand and share.

Email us now